


Why is the 1st Overall NBA Draft Pick Becoming Worse than the 9th Pick?

February 17, 2022
Our sports analyst crunches the numbers to figure out why the numbers are so skewed.
“With the first pick in the 2007 NBA Draft, the Portland Trail Blazers select— Greg Oden.” Hindsight is 20/20, and with his playing career lasting only 3 seasons, I personally may have not made that selection.
Every year, speculation almost always surrounds the 1st pick. Who will it be? Will they play well? Will they become one of the “greats”? Some of those, like LeBron James, who get selected first overall live up to the expectations. Sadly, not everyone can be like LeBron. Many, like Greg Oden, don’t match the next to impossible projections and hype. With variety found in every pick 1-60, it brings up a good question:
What is the best numerical pick?
“Win Shares,” a stat which tracks how many wins a player contributes to their team, is a great way to measure a player’s success, especially throughout an entire career. For example, Stephen Curry recorded almost 18 Win Shares during the Warrior’s 2015-16 season, where they obtained a record of 73-9, the greatest in NBA history. According to Win Shares, if Curry was replaced by another player, the team may have gone 55-27, just good enough for the 3rd or 4th seed in the Western conference.
Let’s let the data speak for itself in Figure 1.
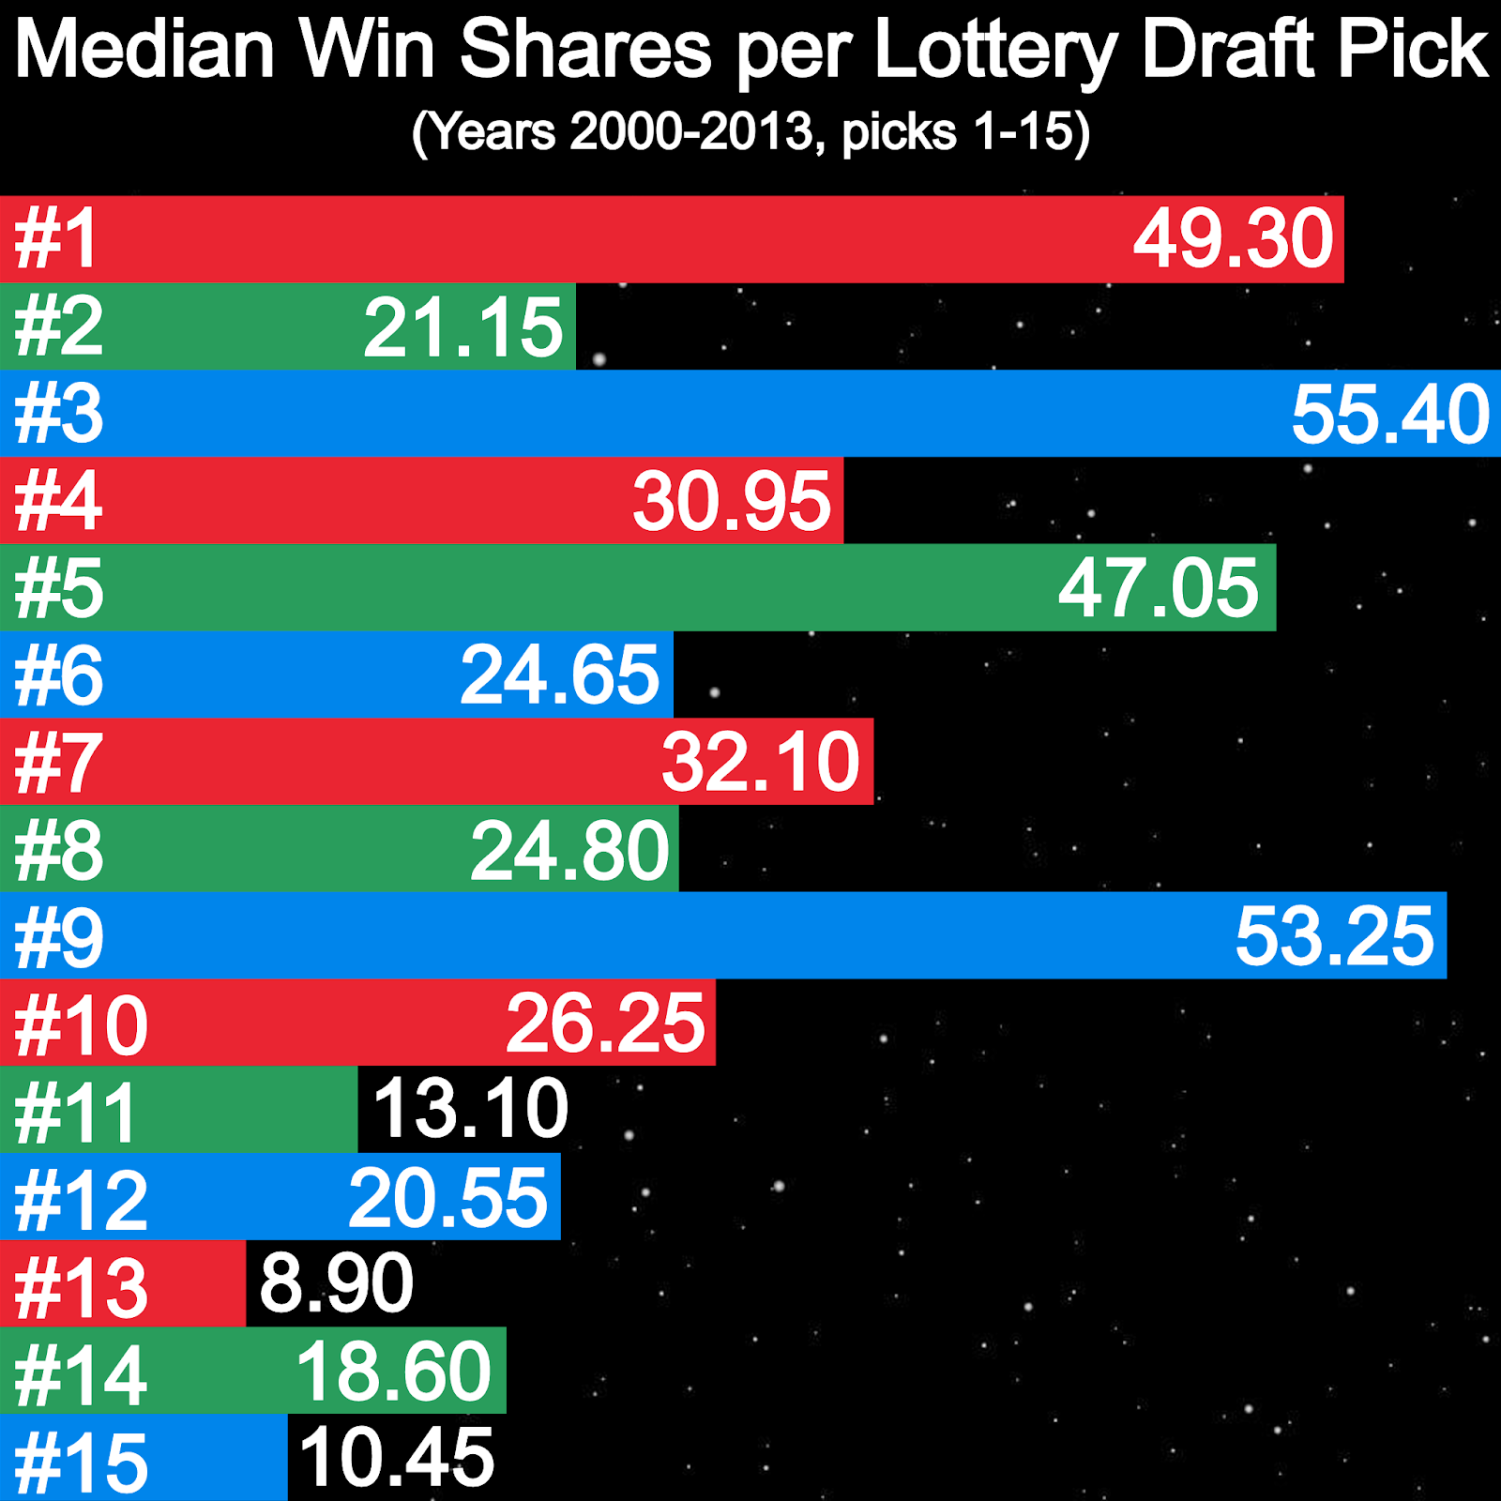
WHAT? This can’t be right. There’s no way that the 10th pick is better than the second? I can believe the 3rd is better than the 1st statistically over time, but the 9th? THE 9TH?!
I began my research expecting more answers than questions, but now it’s vice versa, especially with the 9th pick.
It’s time to look further.
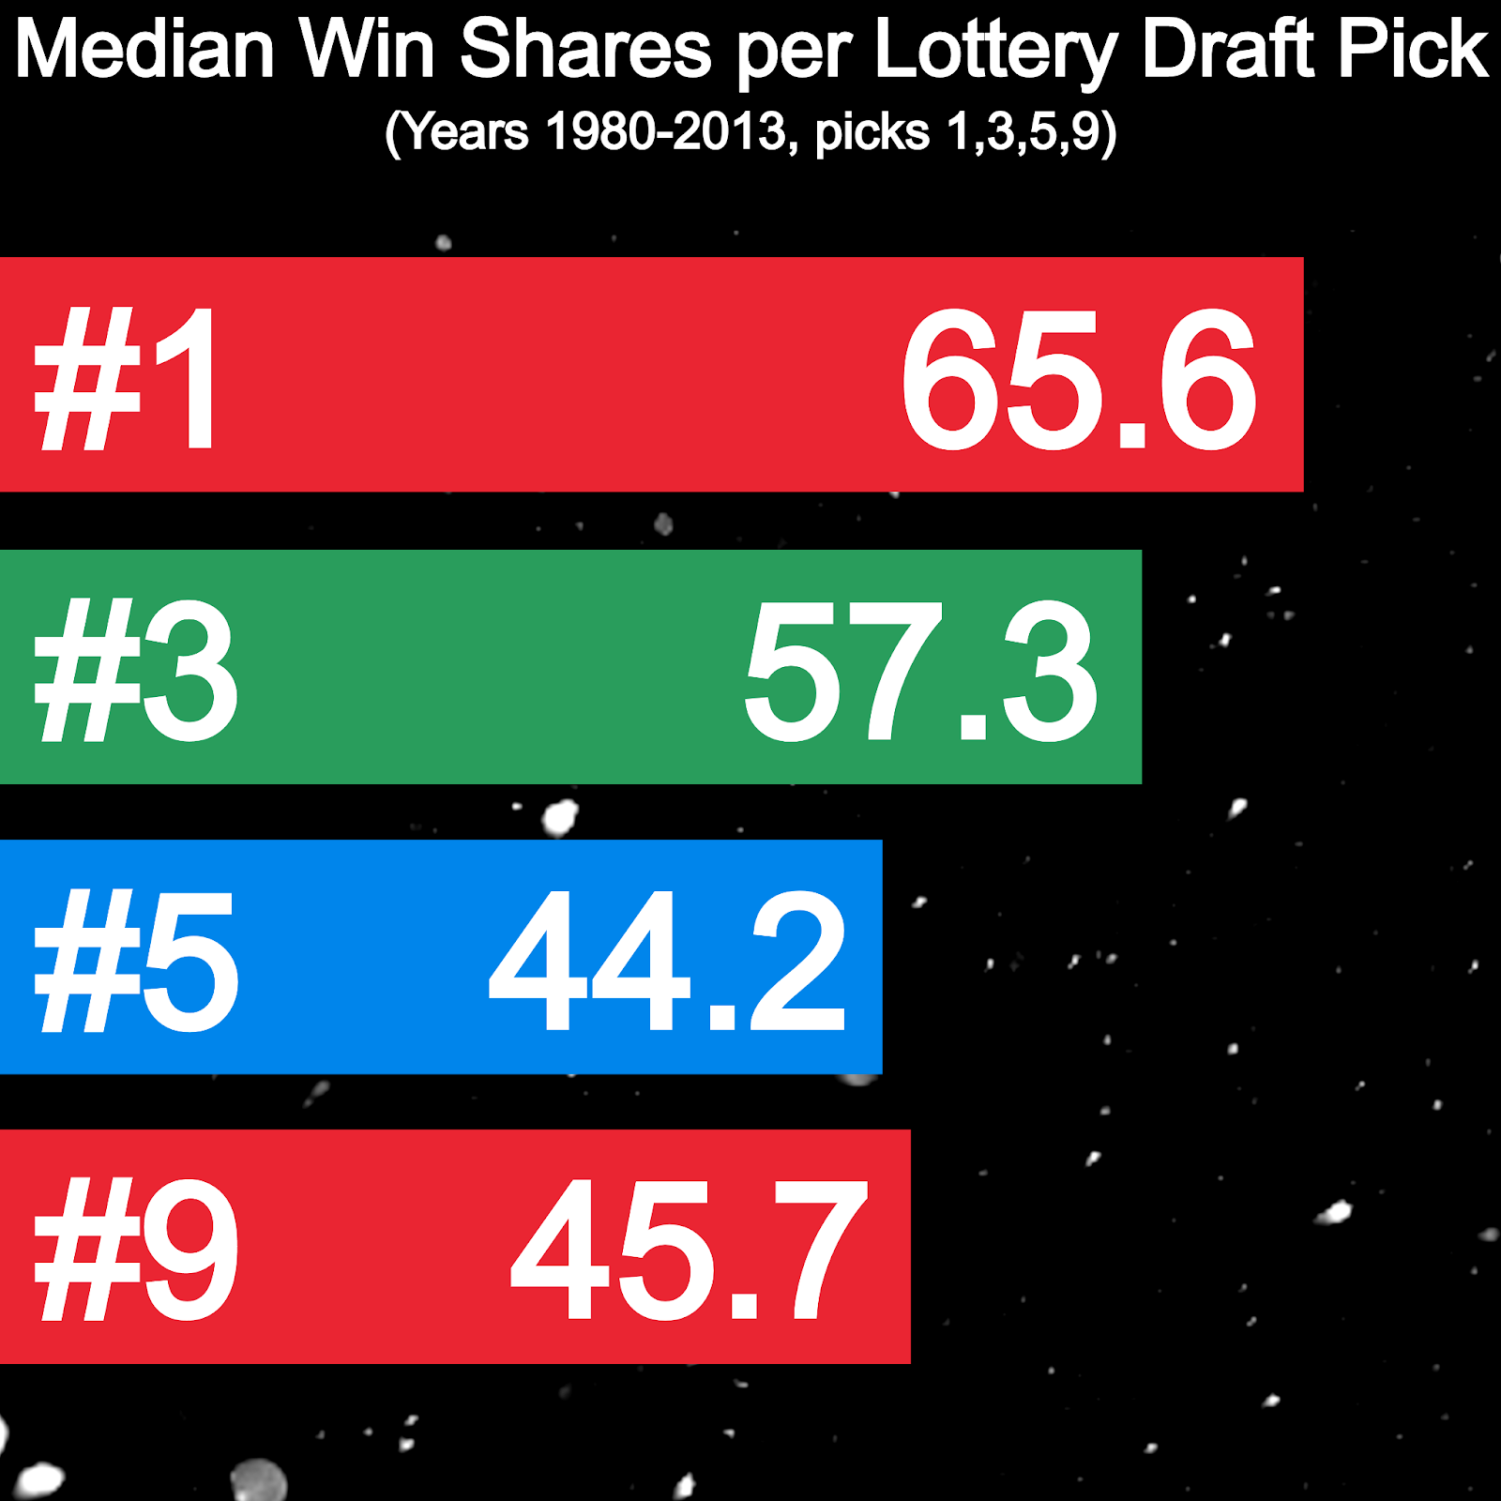
I decided to further expand the time frame. I looked at 20 more years, going from 2000-13 to 1980-2013. This time, I decided to look only at the 1st, 3rd, 5th, and 9th picks, as they showed the most promise from the past data points.
Now this may not reflect the current era, but it provides a more accurate representation historically.
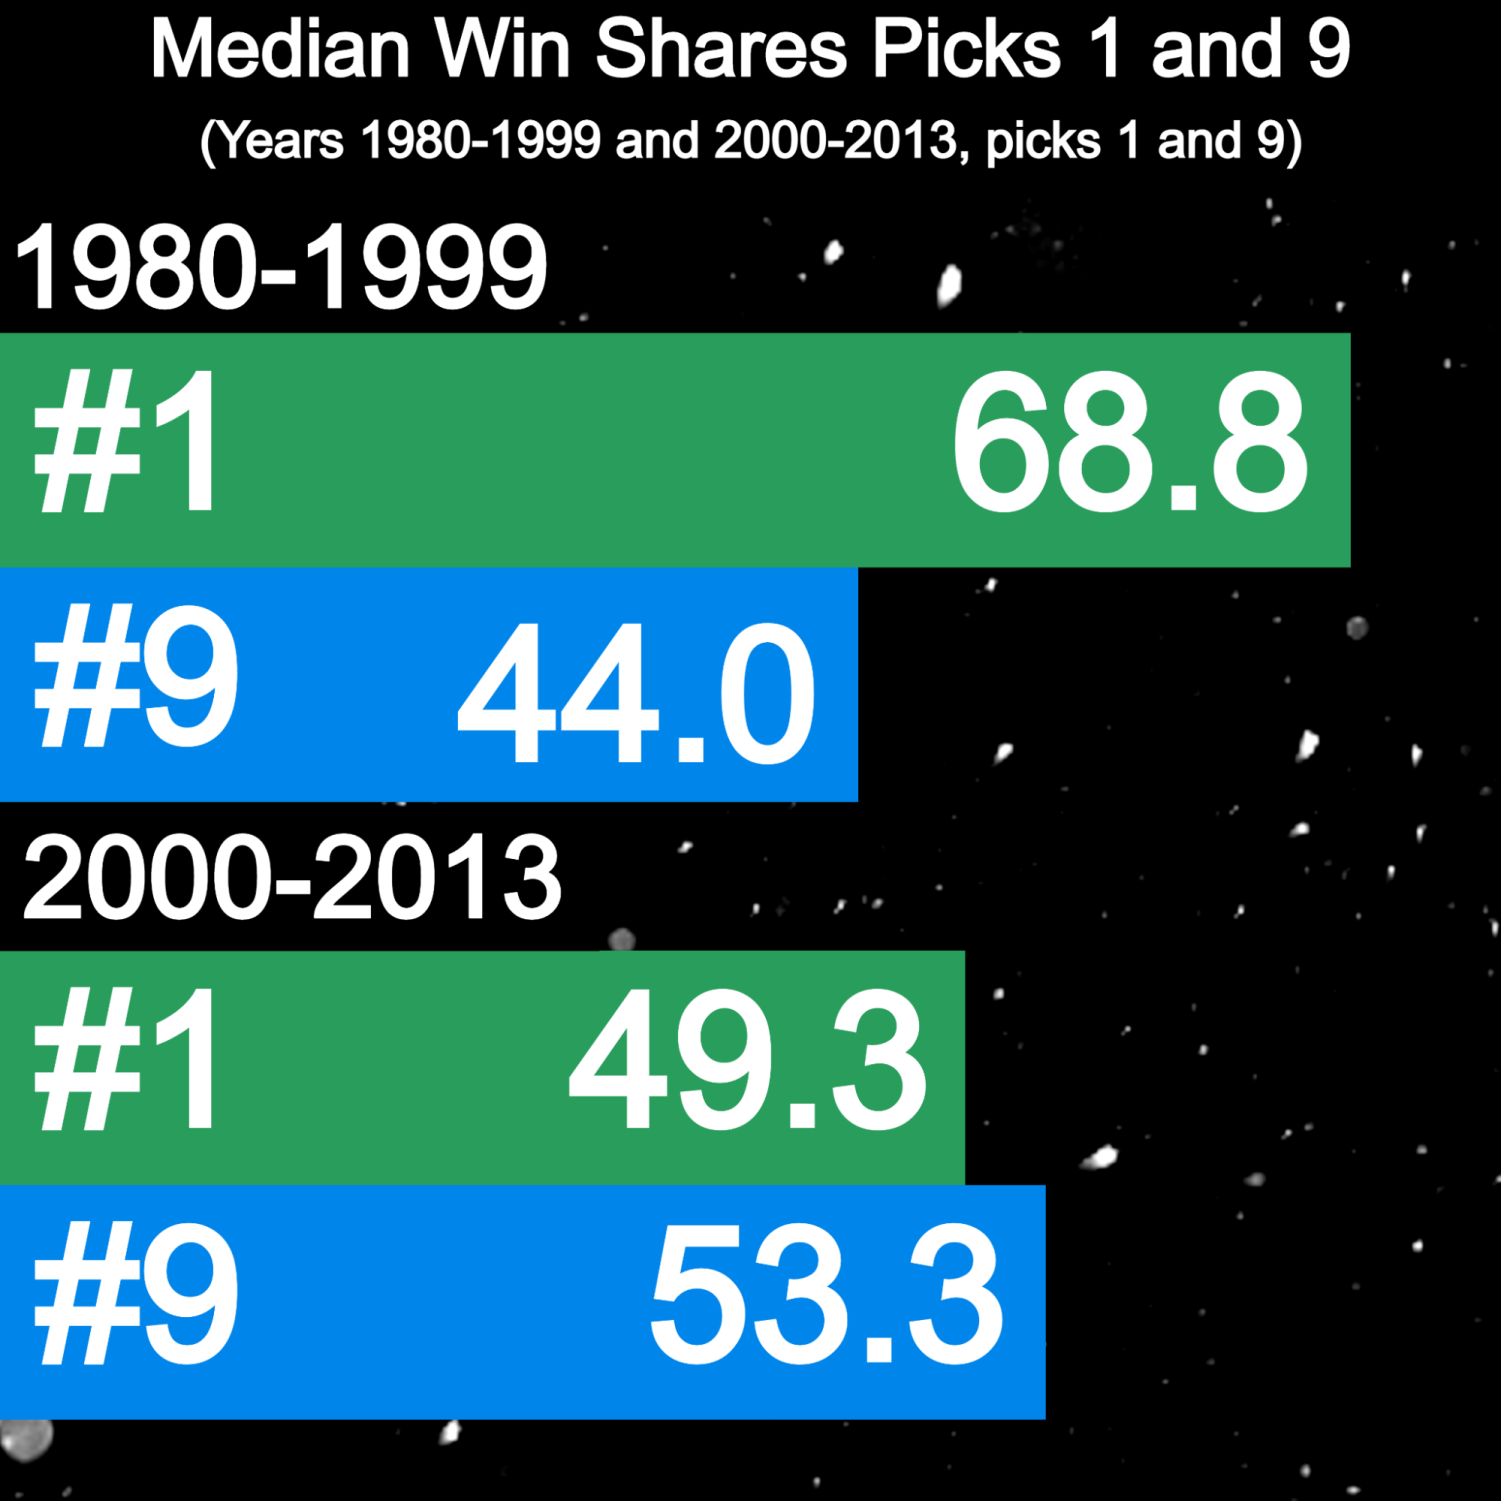
Figure 2? Ah, now that’s better. Adding a few more data points helped make the results more emotionally acceptable. But wait a second, why is the 1st pick now generally better than the other picks compared to before? Is there a difference between the eras in basketball?
From 1980-99, the median average 1st overall pick recorded a 68.8 Win Shares average, while the 9th pick recorded a median average of 44, which seems legit. The first pick should definitely be producing more talent. However, since 2000 to 2013, the 1st pick has a median average of 49.3. The 9th pick has an average of—
This can’t be right (Figure 3)…
…53.3 Win Shares? You could argue that it’s a streak of bad luck, but on the other hand, the average 1st pick dropped by almost 20 Win Shares, which is quite a hefty drop. This may very well be a change in the tide.
Why is this? That’s up to personal interpretation and speculation.
Oh, and remember the Greg Oden story? Well, right after Oden had been selected, the very next pick was 11-time All-Star Kevin Durant.
No matter what happens on draft day, just remember one thing: no matter how many numbers I’ve tricked you into looking at, or any way we crunch the numbers, any pick can become the next Kevin Durant… or Greg Oden.